
New data from traffic counters across the Island shows a notable decline in vehicle activity on the Vineyard this summer — except at the beach, where car totals appear to remain conspicuously consistent with past summers.
The data includes records from three different traffic counters that the Martha’s Vineyard Commission has set up in recent years, including on the Edgartown-West Tisbury Road, on State Road near the West Tisbury-Chilmark town line and at the Big Bridge on Beach Road.
While the counters located on the Island’s interior showed a decline in vehicle activity between 15 and 20 per cent from analogous weekends in 2017, the counter near the Big Bridge showed only a slight decline, signaling that beach traffic remained strong this summer despite decreased activity elsewhere.
“It’s the beach, of all areas on the Island, that’s still unrelenting,” said Dan Doyle, a special projects planner with the Martha’s Vineyard Commission who has headed up the agency’s traffic counting efforts. “I know this is a small subset of samples, but it’s the beach where it is pretty much flat from 2017.”
The traffic analysis uses comparative dates in 2017 because the commission does not have accurate traffic numbers from the counters in 2018 and 2019, Mr. Doyle said.
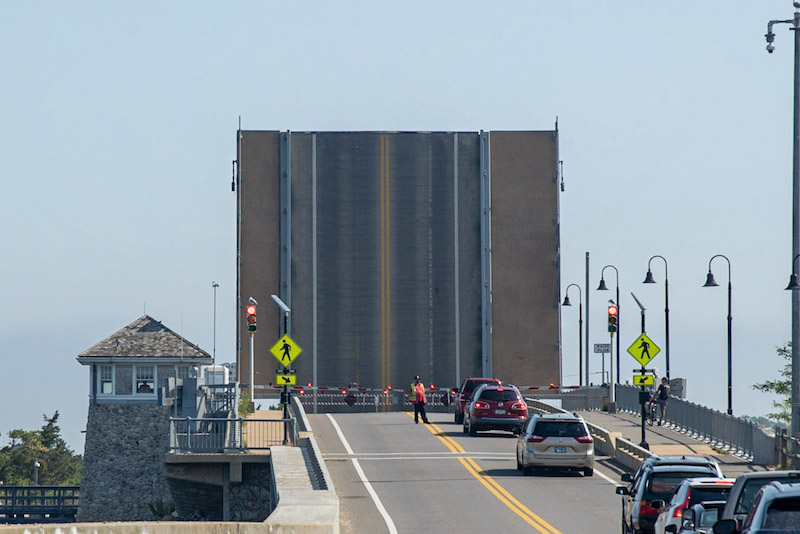
Traffic data from the counter by Big Bridge along Beach Road shows that during the first week of July in 2020, an average of 7,982 cars crossed the bridge daily. During the analogous week in July 2017, a daily average of 8,172 cars crossed the bridge, marking only a two per cent decrease between the week in July 2017 and the week in July 2020.
But the decrease in vehicle traffic was much larger at the two counters located on roads far from the Island’s shoreline.

During the third week in July of 2020, a daily average of 10,208 cars passed by the commissioner’s traffic counter located on the Edgartown-West Tisbury Road just west of the intersection with Barnes Road. The average daily count was a nearly 15 per cent decrease from the third week in July 2017, when 11,804 cars pass by the traffic counter. The Edgartown-West Tisbury Road serves as a major artery between the up-Island towns, the airport and Edgartown.
An even larger decrease in traffic occurred near the intersection of State and South Roads in West Tisbury during a week in August 2020.
Between Thursday, August 13, 2020 and Tuesday, August 18, 2020, a daily average of 5,550 vehicles passed the counter located on State Road near the West Tisbury-Chilmark town line. That marks a 21 per cent decrease from the 6,989 vehicles that crossed the counter during the analogous second weekend in August in 2017.
Both weekends chosen for the comparison preceded the Agricultural Fair, which generally takes place during the third week in August. The fair was held virtually this year, from August 20 through August 23.
Mr. Doyle said the closure of up-Island Cronig’s, as well as a trend away from people making multiple, quick trips down-Island likely are factors in the drop in traffic.
“When people are going grocery shopping, I would imagine they are trying to make it count a little more, rather than saying, ah, I can come back if I need to,” Mr. Doyle said. “That’s a really interesting shift.”
He said the traffic counter data corresponded with reports from the Trustees of Reservations and other beach managers across the Island who say sticker sales have increased, as well as anecdotal observations about traffic in the Island downtowns this summer. While visitors and residents have felt relatively comfortable with outdoor activities, like the beach, there has been significantly less traffic on many of the Island roads.
“If people are going out, they’re probably going somewhere outdoors where they feel safer. They aren’t funneling into the downtowns at the same rate,” Mr. Doyle said. “Even though, anecdotally from people, you’ll hear that the downtown is as crowded as ever. But I think that’s more that our perception has shifted somewhat. What used to be just a busy street now feels overcrowded.”
Early in the pandemic, the commission did a traffic study at all six of the counters on the Island that showed a notable plummet in vehicle activity between March and April. Even as the Island’s population likely saw a moderate increase, total average daily traffic decreased by about 30 per cent, as the state instituted a stay-at-home order. A construction ban was also enacted during April, which likely affected vehicle traffic, Mr. Doyle said.
The commission reported an average daily traffic count of 23,275 in March, and the count fell to 17,972 in April.
A study of traffic on the Edgartown-West Tisbury originally intended for Stop & Shop's Edgartown expansion also showed a marked decrease between select hours and weekdays of April of 2020 and April of 2017. While an estimated average of 386 cars passed through near the intersection with Chase Road between 4:30 and 5:30 p.m. on a Friday in 2017, an average of only 199 passed that location during an analogous time slot in April of 2020, showing a 48 per cent decrease. The decrease was less on weekends, Mr. Doyle said, likely because more people telecommuted for work at the height of the pandemic.
By May of 2020, traffic had picked up again, according to the commission data, which shows a 66 per cent increase in average daily traffic between April and May of 2020. The commission reported an average daily traffic count of 29,751 in May.
Average daily traffic numbers for every month of 2020, provided to the Gazette Friday afternoon, showed that traffic has increased every month of the summer after bottoming out in April. At the traffic counter located on the Edgartown-West Tisbury road, daily average traffic numbers howevered around 3,300 vehicles per day in January in February. March saw a slight dip to 3,023 vehicles per day, with the nadir occurring in April, which saw a daily average of 2,283 vehicles.
But over the next five months, traffic has steadily increased, beginning with an average of 4,015 vehicles in May, and building with 5,987 in June, 7,675 in July. Average daily traffic in 2020 has topped out at 8,850 in August.
Most of the Island’s traffic counters were installed in the fall of 2019, making comparisons to prior summer traffic more difficult.
But Mr. Doyle said the traffic numbers from this summer spoke to a potentially broader change in Island behavior — as places like the beach remain popular safe zones while the Island’s town centers are more often avoided.
“As a big collective, we clearly all shifted a little bit for this pandemic,” Mr. Doyle said. “Some more than others, but everyone to some degree.”


Comments (3)
Comments
Comment policy »