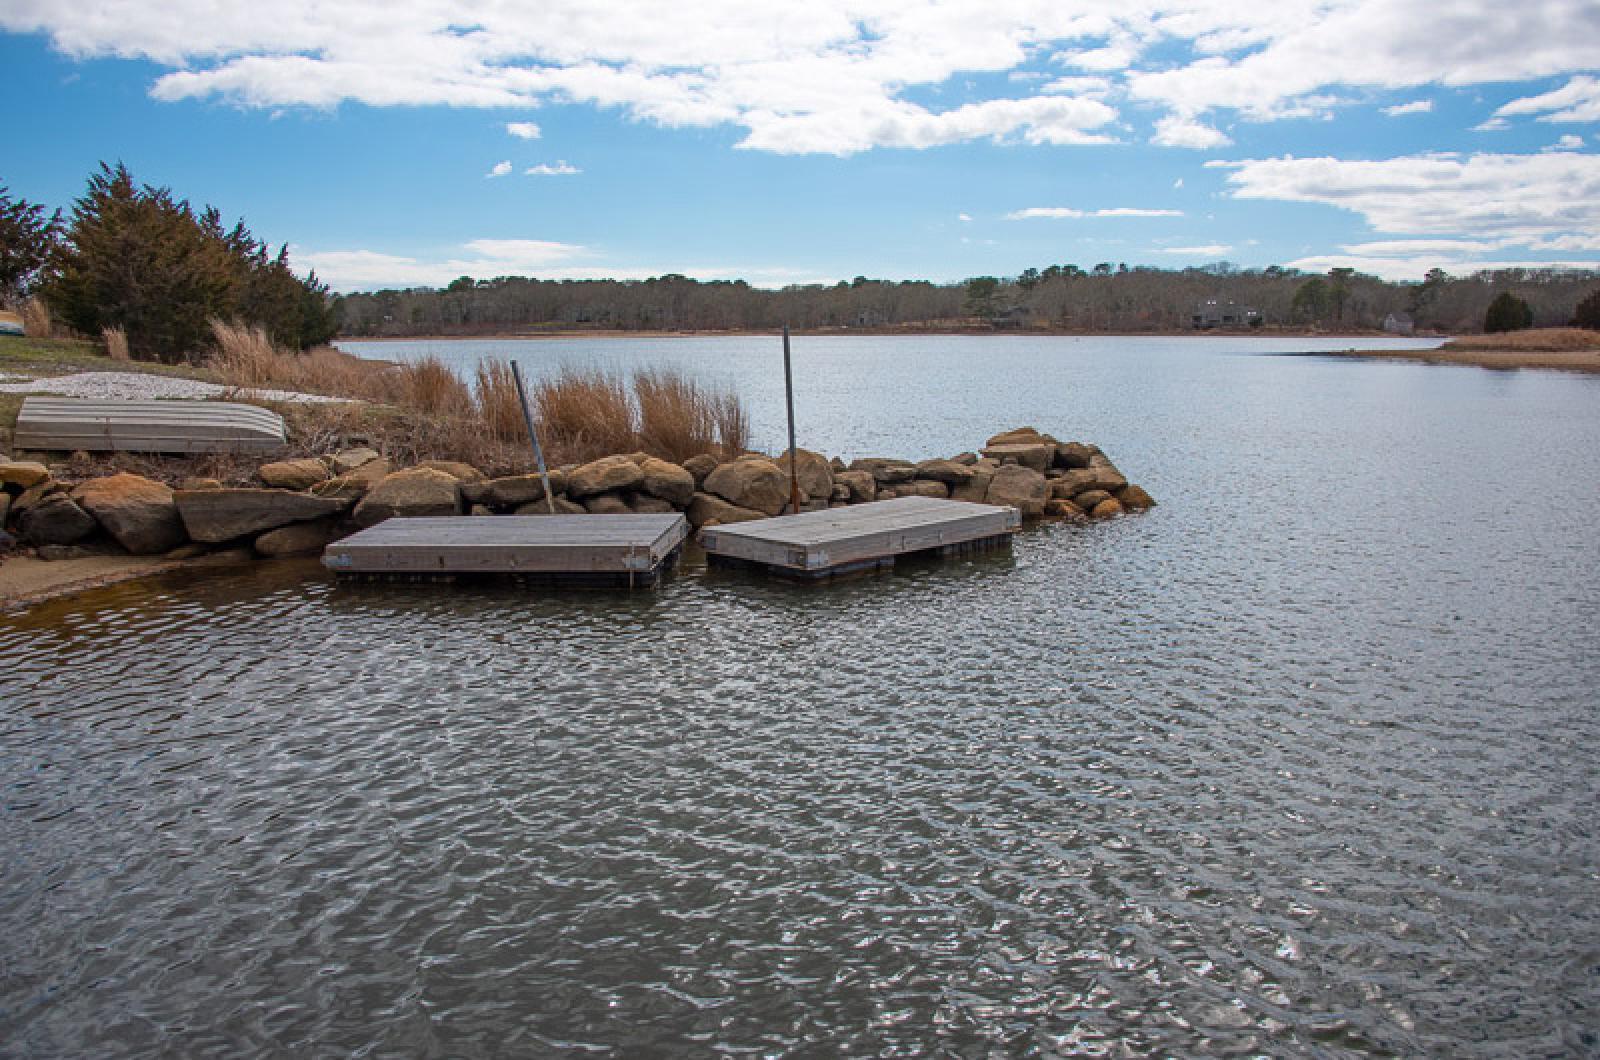
Martha’s Vineyard’s 13 coastal ponds are unique, globally rare estuarine ecosystems that dot the edges of Island, providing recreation, scenic views and a livelihood for shellfishermen and others who make their living on the water.
They are also ecologically fragile and continue to teeter at edge of pollution from too much nitrogen, according to a recent report from the Martha’s Vineyard Commission.
For the past five years, the commission has been conducting extensive water quality sampling at specific locations in the Tisbury Great Pond, Squibnocket Pond, Lake Tashmoo, Lagoon Pond, Chilmark Pond and others. And while nitrogen levels have flat lined or even decreased in many spots, other issues, like increased chlorophyll and algae growth in the ponds continues to make the future of the ponds murky — quite literally.
Excess nitrogen in ponds can cause overstimulation of growth for aquatic plants and algae, in turn suffocating native marine life.
“The nitrogen last year, in most of the ponds — I can’t say all of the ponds — was actually down a little, close to the total daily maximum load or hovering below it,” said Sheri Caseau, the water resource manager for the commission. “But we are also seeing that while the nitrogen goes down, the chlorophyll goes up.”
Ms. Caseau said that a lack of rain over the past two summers has meant smaller amounts of runoff into the ponds, which could be another factor leading to lower nitrogen levels. Both 2018 and 2019 have seen improvements in nitrogen levels compared to 2017, according to the study.
The commission has been testing the ponds in the same locations where state environmental testing began in the early 2000s, using approximately $30,000 in money available from district local technical assistance grants. Testing saw a hiatus for a few years before the commission picked up the testing five years ago.
Considering the amount of development that has occurred around the ponds, Ms. Caseau was surprised that nitrogen levels have remained relatively steady — although steady means close to or above the maximum threshold in many instances.
“I was really surprised that when we first started doing it again, that the nitrogen levels haven’t skyrocketed,” the water quality planner said. “But with the nitrogen in the environment, even a small amount can have a big impact.”
Among other things, the report found Squibnocket Pond had poor water clarity and nutrient levels, while Tashmoo saw increased nutrient pollution and a decline in eelgrass.
Other than nitrogen, a big concern for water quality experts has been the high levels of microscopic plant life in the ponds, which blocks sunlight, preventing the regrowth of vital eelgrass beds.
In Tisbury Great Pond, at the moment one of the most heavily polluted and at-risk coastal pond ecosystems on the Island, the commission determined that water quality was poor to moderate. Of greater concern, however, were two particular arms of the pond at its northwestern-most tips. Although nitrogen levels had decreased from levels found in 2017, the total pigment gradation had increased precipitously, indicating high concentrations of plant life.
The finger-like coves of the pond farthest from the opening were the most impaired, with high chlorophyll levels making the water dark and murky. The northern section of the pond has been closed to shellfishing this season because of the presence of fecal coliform.
“Chlorophyll makes the ponds cloudy and green and causes the dieoffs,” Ms. Caseau explained. “With algae in the water, it clouds the eelgrass and the sun can’t get through. You don’t want cloudy water.”
The reports also showed some positives. Nutrient levels continued to decrease in Tisbury Great Pond. Lake Tashmoo saw a significant decrease in harmful pigmentation, and water quality in the main basin of Lagoon Pond continues to be good.
The commission plans to create an index for the health of each of the Island’s Great Ponds, creating a one-number assessment for water quality in each pond. Ms. Caseau said the numbers would be available this spring.
But she noted that it was impossible to put a true number on the overall health of each pond, saying that each one had a variety of sample sites showing different levels of impairment. For instance, sample sites at the westernmost section of Chilmark Pond showed almost double the nitrogen levels of sites farther east or in the pond basin. In Lagoon Pond, sites farther from the channel consistently showed greater impairment.
“The main basins will be good because they get good flushing, but the areas that are more restricted are showing more impairment,” Ms. Caseau said. “They are not doing as well.”
At a recent commission meeting, executive director Adam Turner said a single-page report card would be prepared for each of the ponds, with the information available on the commission’s website. Previously most information about the ponds has only been available through much larger analyses and studies done by the state Department of Environmental Protection and its university co-sponsored Massachusetts Estuaries Study.
“These are supposed to be for people who don’t have time to read a thousand pages,” Mr. Turner said. “It’s really good data.”


Comments (8)
Comments
Comment policy »